ThinkGeo Cloud
ThinkGeo UI Controls
ThinkGeo Open Source
Help and Support
External Resources
ThinkGeo Cloud
ThinkGeo UI Controls
ThinkGeo Open Source
Help and Support
External Resources
This is an old revision of the document!
The Map Suite WPF QuickStart Guide will guide you through the process of creating a sample application and will help you become familiar with Map Suite. This QuickStart Guide supports Map Suite 10.0.0.0 and higher and will show you how to create a WPF application using Map Suite WPF components.
If you want to build a Winforms application, please see the WinForms QuickStart Guide instead.
Welcome to Map Suite™ from ThinkGeo, a full featured mapping control that makes it easy for any Microsoft .NET developer to add mapping functionality to a Microsoft .NET application quickly and efficiently. Using the intuitive object model, even developers inexperienced in Geographic Information Systems (GIS) can have fully functional maps working in minutes.
The purpose of this guide is to help you quickly get started building your own spatially aware applications. Like any new software, there is some learning to be done.How do we start to learn how to take advantage of the power of Map Suite? The best way is to make a sample application with it.
Please following our Map Suite Desktop guide for winforms development environment. Let's start with a new WPF project in Microsoft Visual Studio (2015 or newer) and call it HelloWorld (see Figure 1). We can create the project with .NET Framework 4.0 or 4.5.
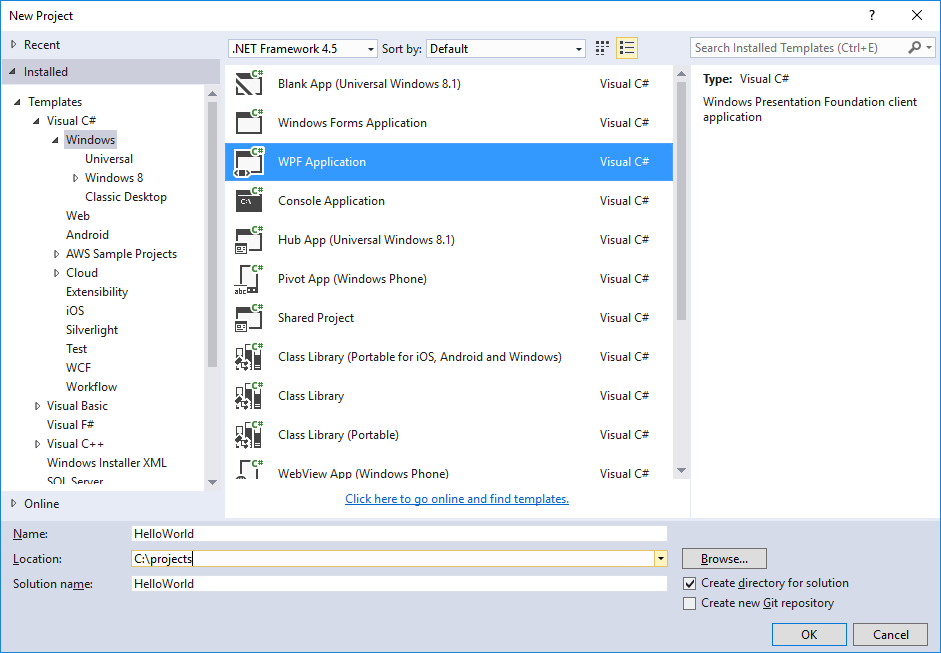
Figure 1. Creating a new project in the Visual Studio IDE.
The project HelloWorld is created in a new solution called HelloWorld. The wizard creates a single WPF Application. Next we need to install MapSuiteDesktopForWpf-BareBone, ThinkGeo.MapSuite.Layers.Background and ThinkGeo.MapSuite.Layers.ShapeFile from nugget package server (see Figure 2-5).
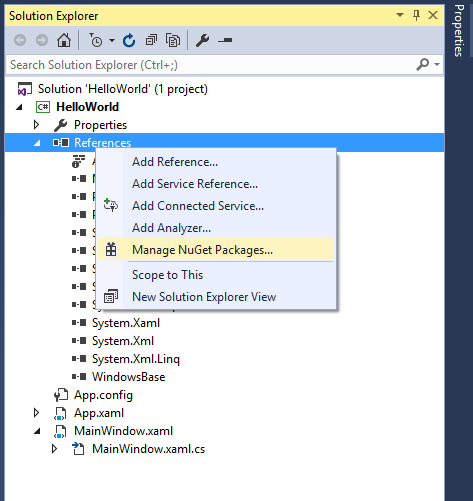
Figure 2. Refer to Manage NuGet Packages.

Figure 3. Refer to MapSuiteDesktopForWpf -BareBone.
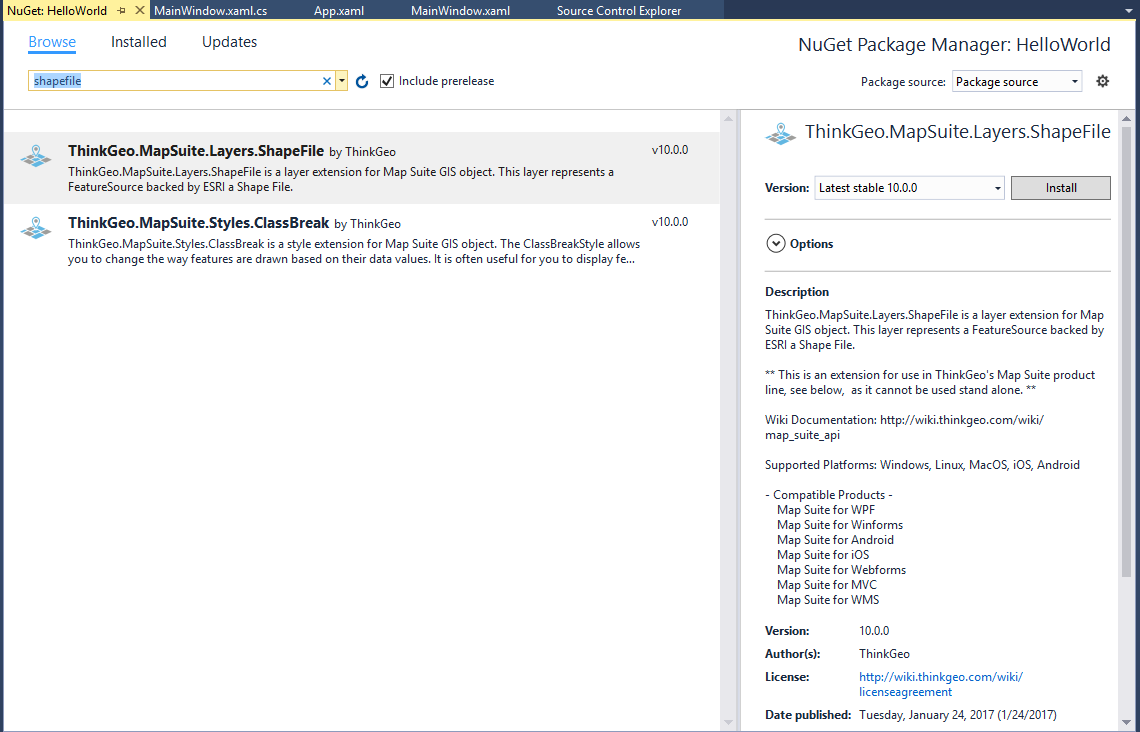
Figure 4. Refer to ThinkGeo.MapSuite.Layers.ShapeFile.
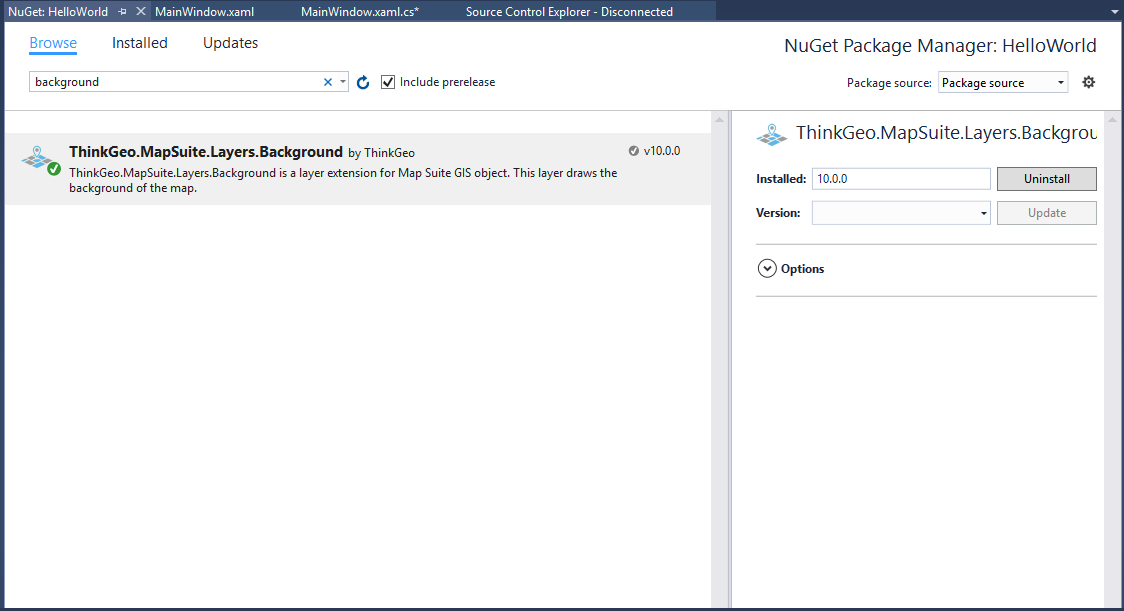
Figure 5. Refer to ThinkGeo.MapSuite.Layers.Background.
Now the package is installing into the project.
The “NetTopologySuite” is the third part assembly, so the license acceptance is required. You can click “I Accept” to agree the license.
You can open your .xaml file and add reference code to refer Wpf map to your application (See Figure 6)
<Window x:Class="HelloWorld.MainWindow"
        xmlns="http://schemas.microsoft.com/winfx/2006/xaml/presentation"
        xmlns:x="http://schemas.microsoft.com/winfx/2006/xaml"
        xmlns:d="http://schemas.microsoft.com/expression/blend/2008"
        xmlns:mc="http://schemas.openxmlformats.org/markup-compatibility/2006"
        xmlns:local="clr-namespace:HelloWorld"
        mc:Ignorable="d"
        xmlns:uc1="clr-namespace:ThinkGeo.MapSuite.Wpf;assembly=ThinkGeo.MapSuite.Wpf"
        Title="MainWindow" Height="600" Width="800">
    <Grid>
        <uc1:WpfMap Name="Map1" Loaded="Map1_Loaded"/>
    </Grid>
</Window>

Figure 6. Add Map Control to your application.
Now it is time to press F5 to start the application. If you have not set up a developer license, the Map Suite Product Center will pop up. You need to generate your developer license. For more details, please refer to http://wiki.thinkgeo.com/wiki/map_suite_developer_license_guide.
Once the developer license is ready, run the application. Your map should look like the one below: (see Figure 7).
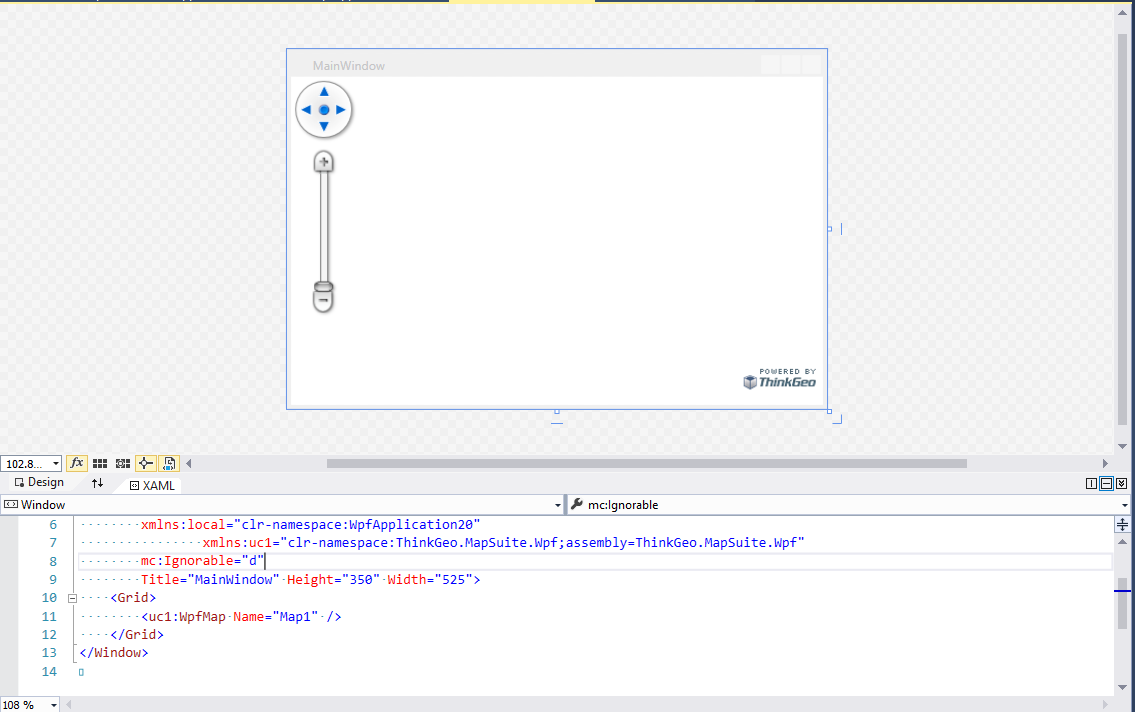 Figure 7. The normal map is rendered after the developer license file has been got.
In creating our “Hello World” sample application, our first step is to set references to the ThinkGeo.MapSuite.Layers, ThinkGeo.MapSuite.Styles and ThinkGeo.MapSuite.Wpf workspaces at the very top of our code, as we will use many classes within them. We do this so that we do not have to use the fully qualified name of the Map Suite classes throughout our code. Setting a reference to the Map Suite workspace can be done in the “code-behind” of the Form by selecting the Form and hitting the F7 function key. Set the reference like this:
using ThinkGeo.MapSuite;
using ThinkGeo.MapSuite.Drawing;
using ThinkGeo.MapSuite.Layers;
using ThinkGeo.MapSuite.Shapes;
using ThinkGeo.MapSuite.Styles;
using ThinkGeo.MapSuite.Wpf;
Now let's look at a code sample to bring this concept to fruition. We'll look at Shapefiles relating to the entire world. In our example, we have one such Shapefile:
* The borders of every country in the world (Countries02.shp)
(NOTE: The data used in this sample can be found in the attached sample above in the “\Data” folder)
Our next step is to define and add our Layers. All of the following code can be placed in the Map1_Loaded event of the form. Here is the code to use for our example.
private void Map1_Loaded(object sender, RoutedEventArgs e)
{
    // Set the Map Unit. The reason for setting it to DecimalDegrees is that is what the shapefile’s unit of measure is inherently in.
    Map1.MapUnit = GeographyUnit.DecimalDegree;
    // We create a new Layer and pass the path to a Shapefile into its constructor.
    ShapeFileFeatureLayer worldLayer = new ShapeFileFeatureLayer(@"../../Data/Countries02.shp");
    AreaStyle areaStyle = new AreaStyle();
    areaStyle.FillSolidBrush = new GeoSolidBrush(GeoColor.FromArgb(255, 233, 232, 214));
    areaStyle.OutlinePen = new GeoPen(GeoColor.FromArgb(255, 118, 138, 69), 1);
    areaStyle.OutlinePen.DashStyle = LineDashStyle.Solid;
    worldLayer.ZoomLevelSet.ZoomLevel01.DefaultAreaStyle = areaStyle;
    // This setting will apply from ZoonLevel01 to ZoomLevel20, that means we can see the world the same style with ZoomLevel01 all the time no matter how far we zoom out/in.
    worldLayer.ZoomLevelSet.ZoomLevel01.ApplyUntilZoomLevel = ApplyUntilZoomLevel.Level20;
    // Create a new Layer Overlay to hold the layer we just created
    LayerOverlay layerOverlay = new LayerOverlay();
    // Add a background Layer
    layerOverlay.Layers.Add(new BackgroundLayer(new GeoSolidBrush(GeoColor.GeographicColors.ShallowOcean)));
    // Add the shapefile layer to the layer overlay
    layerOverlay.Layers.Add(worldLayer);
    // We need to add the layerOverlay to map.
    Map1.Overlays.Add(layerOverlay);
    // Set a proper extent for the Map.
    Map1.CurrentExtent = new RectangleShape(0, 78, 30, 26);
    // We now need to call the Refresh() method of the Map control so that the Map can redraw based on the data that has been provided.
    Map1.Refresh();
}
You can get a normal map render (See Figure 8)
So what has occurred here? We have created a layer and added it to the Map and the Map has rendered according to its default style parameters. Also, we have used ZoomLevel to display the map the way that we want.
NOTE: It is important that the “MapUnit” property of a Map object be set using the “GeographyUnit” enumeration. This is because ShapeFiles only store binary vector coordinates, which can be in DecimalDegree, feet, meters, etc., and our map has no idea about what the unit of measurement is until we set it. This information is normally found somewhere in the documentation or within the supplemental data file as discussed in the section on ShapeFiles.
With the above code, you can both display a map and navigate it. You can pan by dragging the map, zoom in by double-clicking, track zoom in by drawing a rectangle with your left mouse button mouse while holding the shift key, or zoom in and out by using the mouse wheel. Very powerful for just couple lines of code, isn't it?
That was an easy start! Now, let's add another Shapefile to the sample so that we will have a total of two layers:
private void Map1_Loaded(object sender, RoutedEventArgs e)
{
    Map1.MapUnit = GeographyUnit.DecimalDegree;
    ShapeFileFeatureLayer worldLayer = new ShapeFileFeatureLayer(@"../../Data/Countries02.shp");
    AreaStyle areaStyle = new AreaStyle();
    areaStyle.FillSolidBrush = new GeoSolidBrush(GeoColor.FromArgb(255, 233, 232, 214));
    areaStyle.OutlinePen = new GeoPen(GeoColor.FromArgb(255, 118, 138, 69), 1);
    areaStyle.OutlinePen.DashStyle = LineDashStyle.Solid;
    worldLayer.ZoomLevelSet.ZoomLevel01.DefaultAreaStyle = areaStyle;
    worldLayer.ZoomLevelSet.ZoomLevel01.ApplyUntilZoomLevel = ApplyUntilZoomLevel.Level20;
    ShapeFileFeatureLayer capitalLayer = new ShapeFileFeatureLayer(@"../../Data/WorldCapitals.shp");
    PointStyle pointStyle = new PointStyle();
    pointStyle.SymbolType = PointSymbolType.Square;
    pointStyle.SymbolSolidBrush = new GeoSolidBrush(GeoColor.StandardColors.White);
    pointStyle.SymbolPen = new GeoPen(GeoColor.StandardColors.Black, 1);
    pointStyle.SymbolSize = 6;

    PointStyle stackStyle = new PointStyle();
    stackStyle.SymbolType = PointSymbolType.Square;
    stackStyle.SymbolSolidBrush = new GeoSolidBrush(GeoColor.StandardColors.Maroon);
    stackStyle.SymbolPen = new GeoPen(GeoColor.StandardColors.Transparent, 0);
    stackStyle.SymbolSize = 2;

    pointStyle.CustomPointStyles.Add(stackStyle);
    capitalLayer.ZoomLevelSet.ZoomLevel01.DefaultPointStyle = pointStyle;
    // This setting also applies from ZoonLevel01 to ZoomLevel20, that means we can see city symbols the same style with ZoomLevel01 all the time.
    capitalLayer.ZoomLevelSet.ZoomLevel01.ApplyUntilZoomLevel = ApplyUntilZoomLevel.Level20;

    LayerOverlay layerOverlay = new LayerOverlay();
    layerOverlay.Layers.Add(new BackgroundLayer(new GeoSolidBrush(GeoColor.GeographicColors.ShallowOcean)));
    layerOverlay.Layers.Add(worldLayer);
    // We need to add both of the new layers to the Layer OverLay.
    layerOverlay.Layers.Add(capitalLayer);

    Map1.Overlays.Add(layerOverlay);
    Map1.CurrentExtent = new RectangleShape(0, 78, 30, 26);
    Map1.Refresh();
}
And the result is as follows (Figure 9):
TextStyles are used to label items on the map. As every ShapeFile has a relative .dbf file that includes descriptions for every record, the most common way to use TextStyles is for labeling. For example, the WorldCapitals Shapefile's corresponding .dbf file contains the field “CITY_NAME”. We can use this field to label the cities on our map.
Map Suite has many TextStyles built in to help us quickly design attractive labels for the cities on our map. We can just pick the TextStyle we like and use it.
private void Map1_Loaded(object sender, RoutedEventArgs e)
{
    Map1.MapUnit = GeographyUnit.DecimalDegree;

    ShapeFileFeatureLayer worldLayer = new ShapeFileFeatureLayer(@"../../Data/Countries02.shp");
    AreaStyle areaStyle = new AreaStyle();
    areaStyle.FillSolidBrush = new GeoSolidBrush(GeoColor.FromArgb(255, 233, 232, 214));
    areaStyle.OutlinePen = new GeoPen(GeoColor.FromArgb(255, 118, 138, 69), 1);
    areaStyle.OutlinePen.DashStyle = LineDashStyle.Solid;
    worldLayer.ZoomLevelSet.ZoomLevel01.DefaultAreaStyle = areaStyle;
    worldLayer.ZoomLevelSet.ZoomLevel01.ApplyUntilZoomLevel = ApplyUntilZoomLevel.Level20;

    ShapeFileFeatureLayer capitalLayer = new ShapeFileFeatureLayer(@"../../Data/WorldCapitals.shp");
    PointStyle pointStyle = new PointStyle();
    pointStyle.SymbolType = PointSymbolType.Square;
    pointStyle.SymbolSolidBrush = new GeoSolidBrush(GeoColor.StandardColors.White);
    pointStyle.SymbolPen = new GeoPen(GeoColor.StandardColors.Black, 1);
    pointStyle.SymbolSize = 6;

    PointStyle stackStyle = new PointStyle();
    stackStyle.SymbolType = PointSymbolType.Square;
    stackStyle.SymbolSolidBrush = new GeoSolidBrush(GeoColor.StandardColors.Maroon);
    stackStyle.SymbolPen = new GeoPen(GeoColor.StandardColors.Transparent, 0);
    stackStyle.SymbolSize = 2;

    pointStyle.CustomPointStyles.Add(stackStyle);
    capitalLayer.ZoomLevelSet.ZoomLevel01.DefaultPointStyle = pointStyle;
    // This setting also applies from ZoonLevel01 to ZoomLevel20, that means we can see city symbols the same style with ZoomLevel01 all the time.
    capitalLayer.ZoomLevelSet.ZoomLevel01.ApplyUntilZoomLevel = ApplyUntilZoomLevel.Level20;

    // We create a new Layer for labeling the capitals.
    ShapeFileFeatureLayer capitalLabelLayer = new ShapeFileFeatureLayer(@"../../Data/WorldCapitals.shp");
    GeoFont font = new GeoFont("Arial", 9, DrawingFontStyles.Bold);
    GeoSolidBrush txtBrush = new GeoSolidBrush(GeoColor.StandardColors.Maroon);
    TextStyle textStyle = new TextStyle("CITY_NAME", font, txtBrush);
    textStyle.XOffsetInPixel = 0;
    textStyle.YOffsetInPixel = -6;
    // We use the preset TextStyle. Here we passed in the “CITY_NAME”, which is the name of the field we want to label on map.
    capitalLabelLayer.ZoomLevelSet.ZoomLevel01.DefaultTextStyle = textStyle;
    capitalLabelLayer.ZoomLevelSet.ZoomLevel01.ApplyUntilZoomLevel = ApplyUntilZoomLevel.Level20;
    // As the map is drawn by tiles, it needs to draw on the margin to make sure the text is complete after we joining the tiles together.
    // Change the number to another one (for example 0) and you can see the difference expecially when panning.

    LayerOverlay layerOverlay = new LayerOverlay();
    layerOverlay.Layers.Add(new BackgroundLayer(new GeoSolidBrush(GeoColor.GeographicColors.ShallowOcean)));
    layerOverlay.Layers.Add(worldLayer);
    layerOverlay.Layers.Add(capitalLayer);
    layerOverlay.Layers.Add(capitalLabelLayer);

    Map1.Overlays.Add(layerOverlay);
    Map1.CurrentExtent = new RectangleShape(0, 78, 30, 26);
    Map1.Refresh();
}
The result is as follows (Figure 10):
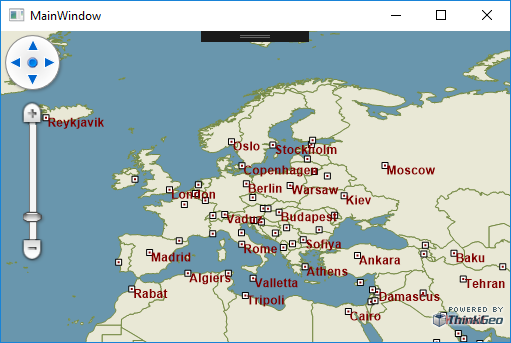
Figure 10. Map of Europe with a TextStyle.
Now that we know how to render text and render symbols, let's define two different ZoomLevels in one single layer, and create our own custom Style and TextStyle.
private void Map1_Loaded(object sender, RoutedEventArgs e)
{
    Map1.MapUnit = GeographyUnit.DecimalDegree;

    ShapeFileFeatureLayer worldLayer = new ShapeFileFeatureLayer(@"../../Data/Countries02.shp");
    AreaStyle areaStyle = new AreaStyle();
    areaStyle.FillSolidBrush = new GeoSolidBrush(GeoColor.FromArgb(255, 233, 232, 214));
    areaStyle.OutlinePen = new GeoPen(GeoColor.FromArgb(255, 118, 138, 69), 1);
    areaStyle.OutlinePen.DashStyle = LineDashStyle.Solid;

    worldLayer.ZoomLevelSet.ZoomLevel01.DefaultAreaStyle = areaStyle;
    worldLayer.ZoomLevelSet.ZoomLevel01.ApplyUntilZoomLevel = ApplyUntilZoomLevel.Level20;

    PointStyle pointStyle = new PointStyle();
    pointStyle.SymbolType = PointSymbolType.Square;
    pointStyle.SymbolSolidBrush = new GeoSolidBrush(GeoColor.StandardColors.White);
    pointStyle.SymbolPen = new GeoPen(GeoColor.StandardColors.Black, 1);
    pointStyle.SymbolSize = 6;

    PointStyle stackStyle = new PointStyle();
    stackStyle.SymbolType = PointSymbolType.Square;
    stackStyle.SymbolSolidBrush = new GeoSolidBrush(GeoColor.StandardColors.Maroon);
    stackStyle.SymbolPen = new GeoPen(GeoColor.StandardColors.Transparent, 0);
    stackStyle.SymbolSize = 2;

    pointStyle.CustomPointStyles.Add(stackStyle);
    ShapeFileFeatureLayer capitalLayer = new ShapeFileFeatureLayer(@"../../Data/WorldCapitals.shp");
    // We can customize our own Style. Here we passed in a color and a size.
    capitalLayer.ZoomLevelSet.ZoomLevel01.DefaultPointStyle = PointStyles.CreateSimpleCircleStyle(GeoColor.StandardColors.White, 7, GeoColor.StandardColors.Brown);
    // The Style we set here is available from ZoomLevel01 to ZoomLevel05. That means if we zoom in a bit more, the appearance we set here will not be visible anymore.
    capitalLayer.ZoomLevelSet.ZoomLevel01.ApplyUntilZoomLevel = ApplyUntilZoomLevel.Level20;


    capitalLayer.ZoomLevelSet.ZoomLevel06.DefaultPointStyle = pointStyle;
    // The Style we set here is available from ZoomLevel06 to ZoomLevel20. That means if we zoom out a bit more, the appearance we set here will not be visible any more.
    capitalLayer.ZoomLevelSet.ZoomLevel06.ApplyUntilZoomLevel = ApplyUntilZoomLevel.Level20;

    ShapeFileFeatureLayer capitalLabelLayer = new ShapeFileFeatureLayer(@"../../Data/WorldCapitals.shp");
    // We can customize our own TextStyle. Here we passed in the font, the size, the style and the color.
    GeoFont font = new GeoFont("Arial", 9, DrawingFontStyles.Bold);
    GeoSolidBrush txtBrush = new GeoSolidBrush(GeoColor.StandardColors.Maroon);
    TextStyle textStyle = new TextStyle("CITY_NAME", font, txtBrush);
    textStyle.XOffsetInPixel = 0;
    textStyle.YOffsetInPixel = -6;
    capitalLabelLayer.ZoomLevelSet.ZoomLevel01.DefaultTextStyle = TextStyles.CreateSimpleTextStyle("CITY_NAME", "Arial", 8, DrawingFontStyles.Italic, GeoColor.StandardColors.Black, 3, 3);
    // The TextStyle we set here is available from ZoomLevel01 to ZoomLevel05.
    capitalLabelLayer.ZoomLevelSet.ZoomLevel01.ApplyUntilZoomLevel = ApplyUntilZoomLevel.Level05;

    capitalLabelLayer.ZoomLevelSet.ZoomLevel06.DefaultTextStyle = textStyle;
    // The TextStyle we set here is available from ZoomLevel06 to ZoomLevel20.
    capitalLabelLayer.ZoomLevelSet.ZoomLevel06.ApplyUntilZoomLevel = ApplyUntilZoomLevel.Level20;

    LayerOverlay layerOverlay = new LayerOverlay();
    layerOverlay.Layers.Add(new BackgroundLayer(new GeoSolidBrush(GeoColor.GeographicColors.ShallowOcean)));
    layerOverlay.Layers.Add(worldLayer);
    layerOverlay.Layers.Add(capitalLayer);
    layerOverlay.Layers.Add(capitalLabelLayer);

    Map1.Overlays.Add(layerOverlay);
    Map1.CurrentExtent = new RectangleShape(0, 78, 30, 26);
    Map1.Refresh();
}
Can you imagine what the map will look like now? Below is the result. At first it appears like figure 11, and the map changes to figure 12 as you zoom in.

Figure 11. Map of Europe with two ZoomLevels, before Zoom In.
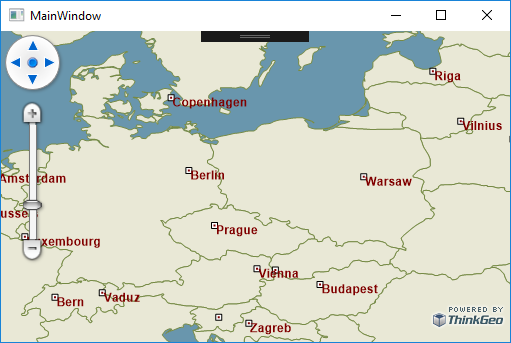
Figure 12. Map of Europe with two ZoomLevels, after Zoom In.
This completes this scneario. The next thing you might want to do is to make it run on another machine that does not have a developer license. A runtime license is the one we are looking for. Here is a guide to generate a runtime license to satisfy it, please refer to (http://wiki.thinkgeo.com/wiki/map_suite_runtime_license_guide_for_desktop ) for details.
Because the Map Suite Wpf uses multi-threading internally for drawing, if you want to change an overlay after the map is initialized, you need to lock the overlay first to avoid threading conflicts. For more information, please have a look at our “How Do I?” sample applications that come with the product.
You now know the basics of using the Map Suite Map control and are able to get started adding functionality into your own applications. Let's recap what we have learned about the object relationships and how the pieces of Map Suite work together: